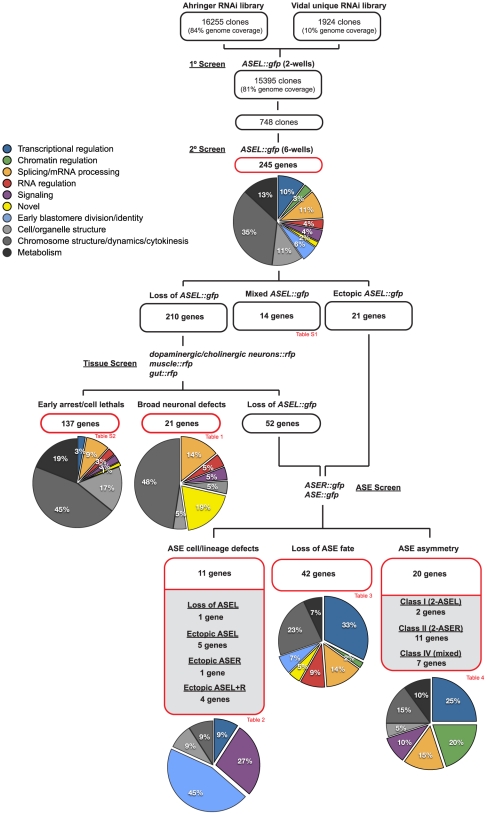
Figure 3. Overview of the screening strategy.
A flow chart illustrating the screening strategy. The number of RNAi clones screened is indicated and at each step the number of genes identified in each phenotypic category is depicted. The pie-charts illustrate the percentage of genes in each of several defined functional categories at each step (see color key). See the text for details on categorization criteria and see the indicated tables (Table 1, Table 2, Table 3, Table 4, and Tables S1 and S2) for the list of genes in each category, a more detailed phenotypic description and their functional categorization.

