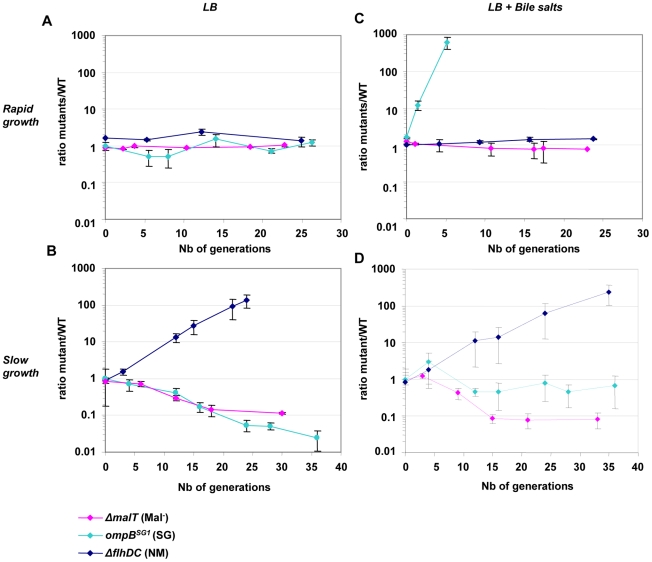
Figure 3. Deletion of flhDC genes confers a growth advantage in chemostat.
Evolution over time (in days) of the ratio of mutant (green) to WT (red) CFU in chemostats inoculated with E. coli MG1655 and either isogenic ompB SG1 (possessing the point mutation in ompB of the SG1 mutant, pale blue symbols), ▵flhDC (dark blue symbols) or ▵malT (pink symbols) strain mixed at initial ratios of 1∶1. (A) Competition in rich LB media (doubling time of 20 minutes). (B) Competition in chemostat, in condition of limited nutrient availability (doubling time of 160 minutes). (C) Competition in rich LB media but in the presence of bile salts at 0.8% w/v. (D) Competition in limited nutrient availability and in the presence of bile salts. After one day (about ten generations), NM mutants appear in the WT population, likely accounting for the change in the outcome of the competition. Means and standard errors of four experiments are shown.

