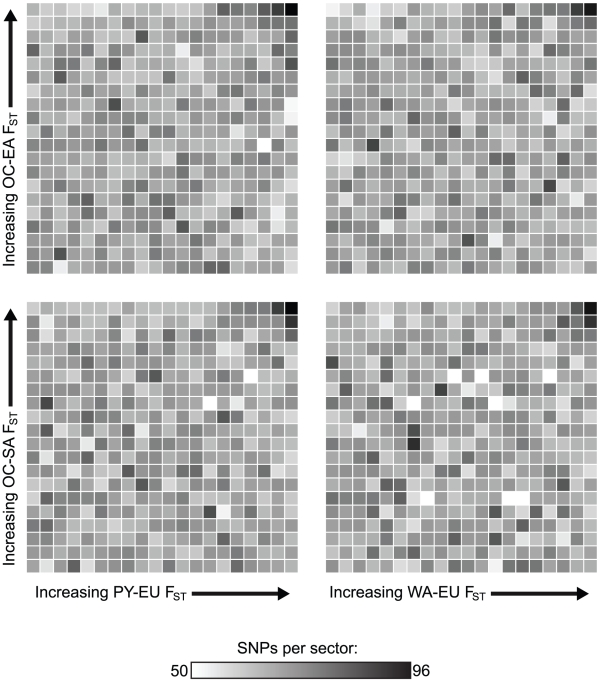
Figure 3. Heat map showing ranks for four divergence comparisons.
FST between Africa (PY or WA) and Europe (EU) is compared with FST between Oceania (OC) and East Asia (EA) or South America (SA). In each plot, FST values for a mean of 26,864 randomly selected SNPs have been ranked for both group pairs and are plotted against each other in order of increasing FST; darker shades represent a high proportion of SNPs falling in that particular sector. The sector in the upper right corner of each plot, representing all parallel divergent SNPs at a threshold of 5%, contains more SNPs than any other similarly-sized sector in that plot. These divergence comparisons are phylogenetically independent because the common ancestor of Oceania/Asia/America existed more recently than the common ancestor shared by these three groups and Europe or Africa. Thus, divergent natural selection acting independently both between Europe and Africa and between Oceania and Asia/America is the best explanation for this observation. Convergence due to gene flow would cause a positive correlation throughout each plot, even after excluding high-FST SNPs, and parallel occurrences of purifying selection would cause the sectors in the lower left corner of each plot to be the darkest; these patterns are not observed.

