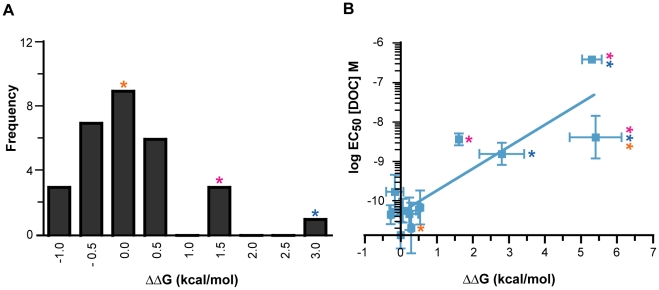
Figure 6. The effect of historical GR substitutions on AncCR protein stability, predicted by FoldX [43].
A) The distribution of stability effects (ΔΔG) for almost all (n = 29 of 36) single GR substitutions in the AncCR background. Colored asterisks indicate bins with notable mutants: V43A (pink), R116H (blue), and C71S (orange). B) For those mutants in which hormone sensitivity was assessed (n = 10, plus AncCR), the predicted loss of stability correlates well with the observed loss of sensitivity towards DOC. Linear regression with C71S mutants, r2 = 0.78; without, r2 = 0.89. Single and combination mutants are colored as in (A). X values are the average of five FoldX runs with standard deviation; Y values are the mean of triplicate reactions with standard error. The intercept lies at values for AncCR (0, −10.870).

