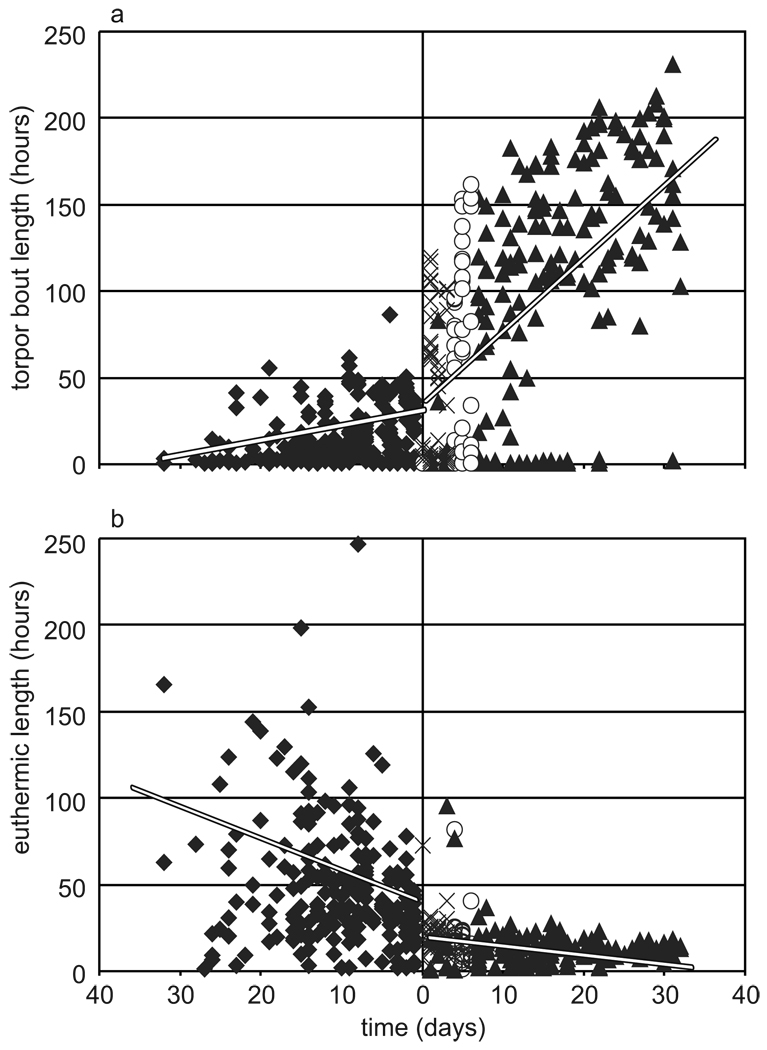
Fig. 5.
Increase in use of torpor throughout the fall transition. Events occurring at Ta 20, 14, 9 or 4°C are marked by diamonds, x, open circles, and triangles, respectively. Day 0 was date of transfer into the hibernaculum. a) Plot of torpor bout length over time. Torpor bouts decrease in length as fall progresses at Ta = 20°C (R2 = 0.10, p = 1.7 × 10⁻⁶) and Ta = 4°C (R2 = 0.36, p = 2.2 × 10⁻¹⁶) although the decrease is greater after transfer to the hibernaculum. b) Plot of euthermic interval over time. As animals progressed through the fall transition, the time spent euthermic decreased (R2 = 0.07, p = 1.1 × 10⁻⁴). Euthermic intervals further decreased upon transfer to the hibernaculum (R2 = 0.06, p = 4.9 × 10⁻⁵).

