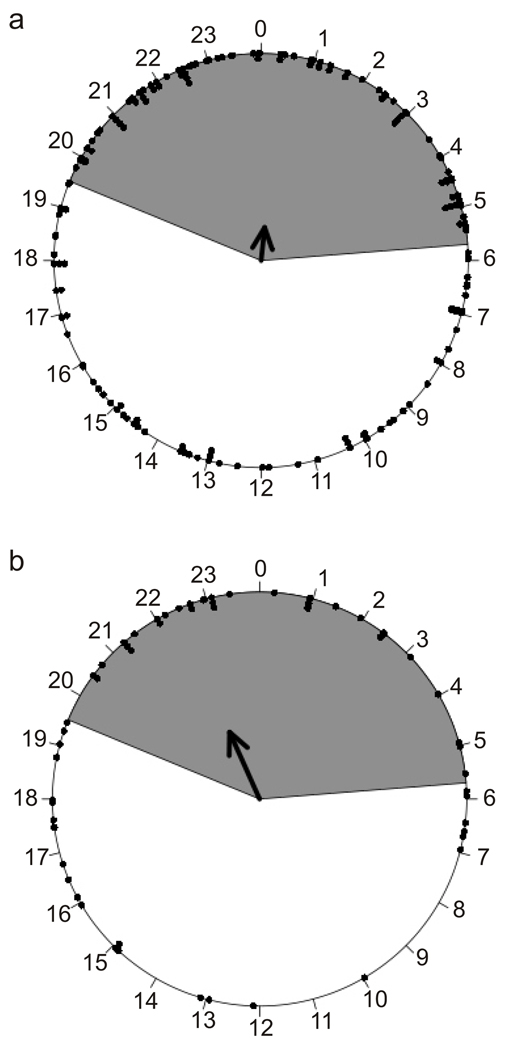
Fig. 6.
Distribution of entrance times on a 24hr clock for torpor bouts occurring at Ta = 20°C. a) Torpor bouts <1day, the entrance times are not uniform (Rayleigh uniformity p-value=0.01), with a preferred mean entrance time of 00:24 (r=0.1611, S2=0.8389, Rayleigh preferred mean p-value=0.002, n=167). b) Multiday torpor bouts, the entrance times are not uniform (Rayleigh uniformity p-value=0.0007), with a preferred mean entrance time of 23:24 (r=0.3544, S2=0.6456, Rayleigh preferred mean p-value=0.0001, n=58). The arrows define the mean preferred entrance time, and the length of the arrow indicates the concentration (r). Each dot represents the time at which Tb dropped to ≤32°C; the dark phase of the L:D cycle is indicated by gray shading.

