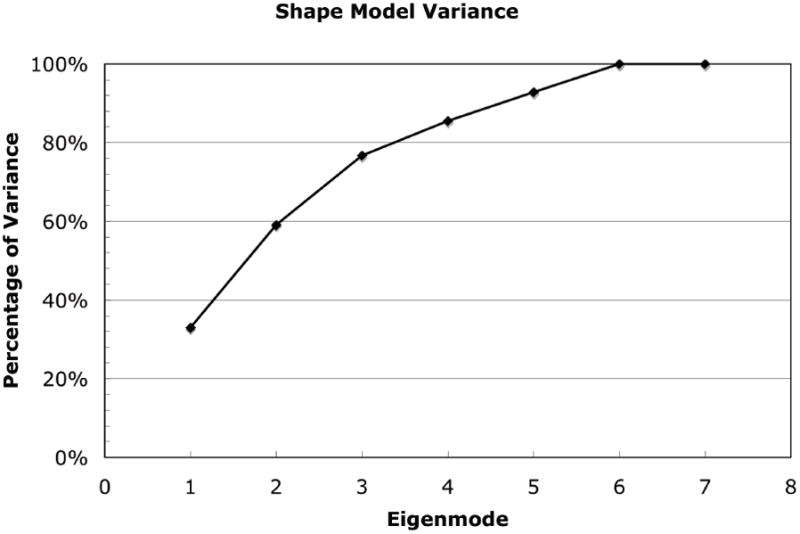
Figure 6.

Percentage of total cadaver femur training set variance explained by statistical shape and density model (SSDM) eigenmodes. Nearly 80% of the total variance in proximal femur shape and bone density distribution can be explained by three independent shape and density model eigenmodes. 100% of the variance in the training set is explained by 6 eigenodes.
