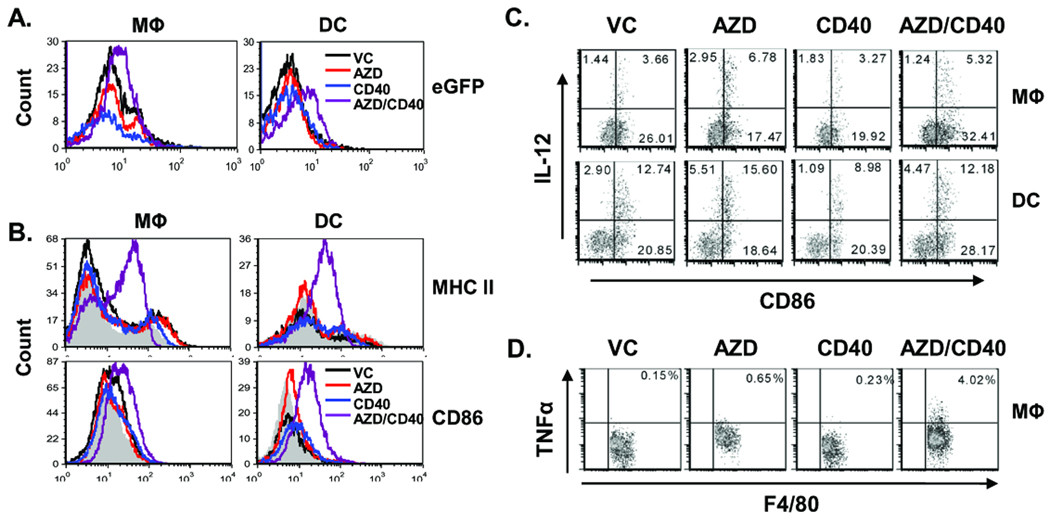
Figure 4.
Macrophages and DCs were activated in livers of AZD8055/αCD40 -treated mice. eGFP- expressing Renca (A) or Renca cells (B–D) were injected intrasplenically. Splenectomies were done on all mice immediately after tumor injection αCD40 (65 µg, i,.p.) and AZD8055 (20mg/kg weight, oral gavage) were administered according to schedule a in Figure 1B. Hepatic mononuclear cells were isolated from livers on day 14 and analyzed by flow cytometry. Macrophages and DCs were identified as F4/80+CD45+ cells and CD3−NKp46−F4/80−CD11c+ CD45+ cells, respectively. A, eGFP phagocytosis by macrophages and DCs, B, CD86 and MHC class II expression on macrophages and DCs. The gray solid area in the histogram represents isotype control staining. C–D, IL-12 production by macrophages and DCs (C) and TNFα production by macrophages (D) were evaluated by intracellular staining, with LPS restimulation performed as indicated in the Materials and Methods section. Numbers indicate the percentages among macrophages or DCs. All data are representative of two or three independent experiments.

