
Figure 1.
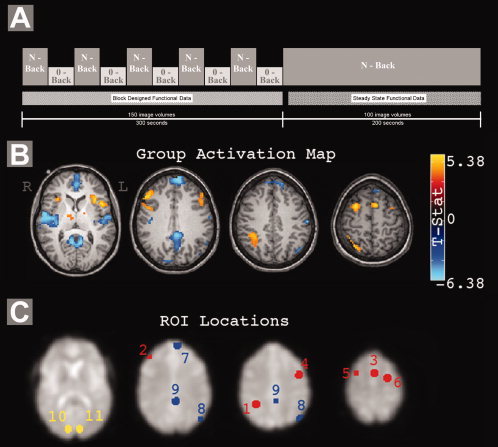
A: Summary of the N‐back tasks. Block designed task data were used for activation map calculation while steady state data were used for functional connectivity analyses. B: Group activity map, showing the main effect of task across loads. C: ROI locations. Chosen regions generally coincide with those identified by previous working memory and default mode studies. Red, task positive network; blue, task negative network; yellow, control regions. ROI number key is in Table I.