
Figure 5.
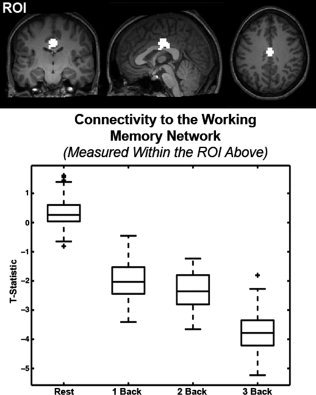
Quantification of the effect of load on functional connectivity between the region highlighted in Figure 4 and the working memory network. (top) An ROI was defined as the overlap between those cingulate voxels that are negatively correlated to the working memory network (across loads, P < 0.05, FDR corrected) and whose connectivity was significantly affected by load (P < 0.05 uncorrected). (bottom) A standard box plot of the ROI's connectivity to the working memory network at each steady state load. Box lines are at the lower quartile, median, and upper quartile of the data. Whiskers extend from each end of the box to the adjacent values in the data. Outliers are data with values beyond the ends of the whiskers. Note that functional connectivity to the working memory network becomes increasingly negative within the ROI as load increases.