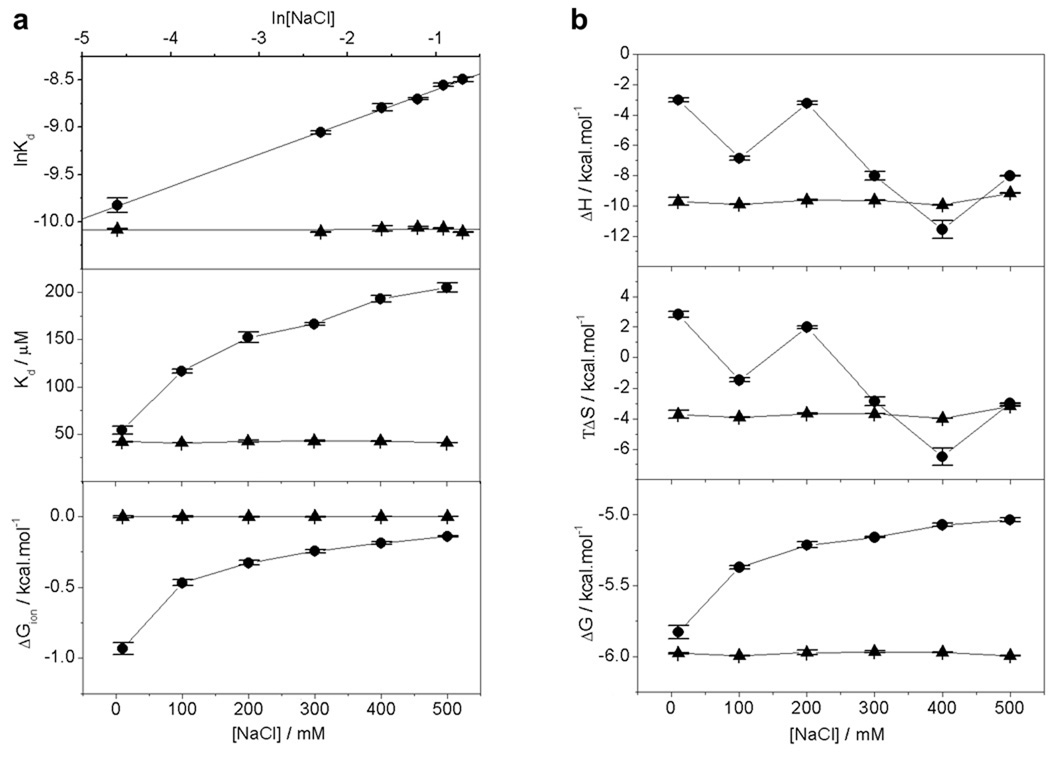
Figure 3.
Effect of salt on the energetics of binding of cSH3 domain of Grb2 to Gab1-derived peptides G1 and G2 as analyzed by ITC. (a) lnKd versus ln[NaCl] plots (upper panel), Kd versus [NaCl] plots (middle panel) and ΔGion versus [NaCl] plots (lower panel) for the binding of cSH3 domain to G1 peptide (●) and G2 peptide (▲). In the upper panel, the solid lines show linear fits to the data points, while solid lines in the middle and lower panels are merely used to connect data points for clarity. (b) Dependence of thermodynamic parameters ΔH, TΔS and ΔG on [NaCl] for the binding of cSH3 domain to G1 peptide (●) and G2 peptide (▲). The solid lines in all panels are merely used to connect data points for clarity. Each data point is the arithmetic mean of 3–4 independent experiments. All error bars are given to one standard deviation.

