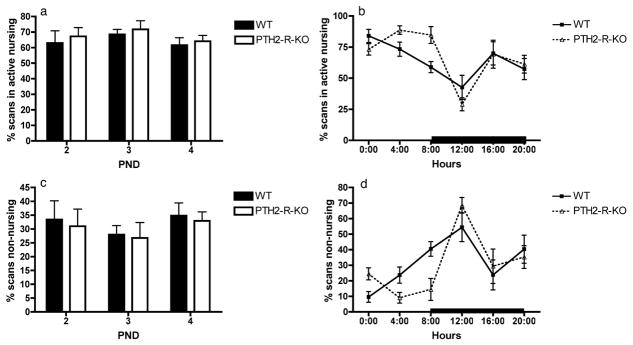
Figure 2.
Representation of the maternal behavior observed in WT and PTH2-R-KO dams as a percentage of scans spent in active nursing (a and b) or spent in non-nursing behavior (c and d). (a) and (c) the percentage of scans spent in each behavior over the 6 time-windows was averaged to obtain one value per PND (post-natal day); (b) and (d) the percentage of scans spent in each behavior over the 3 PND was averaged to obtain one value per hour. The black bar represents the dark phase of the light/dark cycle.

