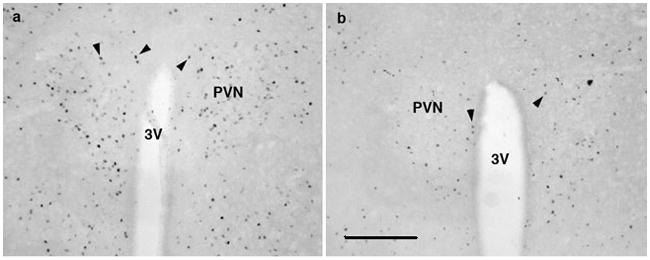
Figure 5.

Representative micrographs showing the expression of c-Fos protein within the paraventricular nucleus of the hypothalamus (PVN) of WT and PTH2-R-KO dams (a and b, respectively) after a 90-min suckling stimulus. 3V: 3rd ventricule. The bar scale represents 100μm.
