
Figure 3.
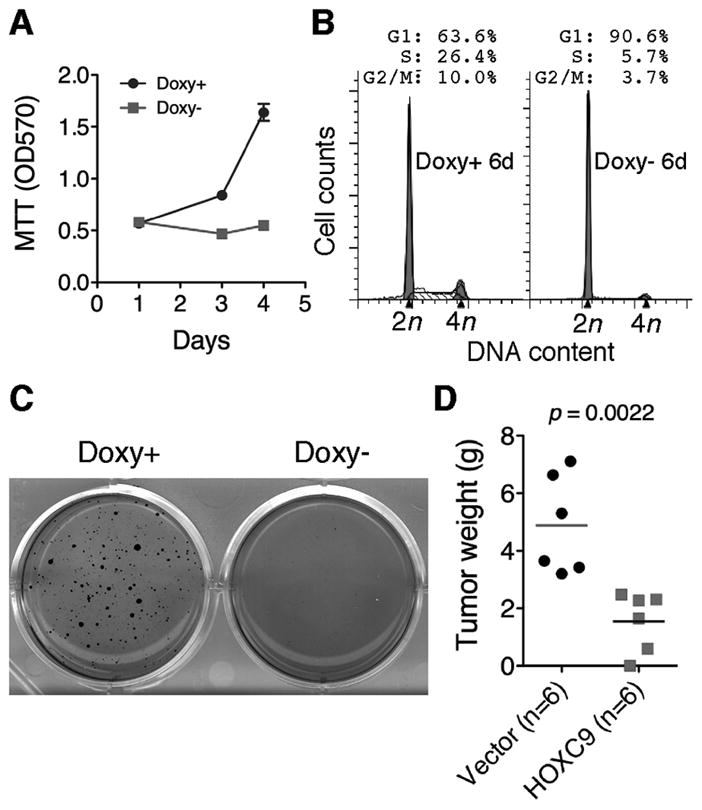
HOXC9 induces G1 arrest. A, Proliferation assays of BE(2)-C cells with or without HOXC9 induction (error bars, s.d., n=6). B–C, Cell cycle analysis (B) and soft agar clonogenic assays (C) of BE(2)-C cells with or without HOXC9 induction. D, Scatter plot of xenograft tumor weight with horizontal lines indicating the mean per group. Data were analyzed with two-tailed Student’s t-test with the p value indicated.