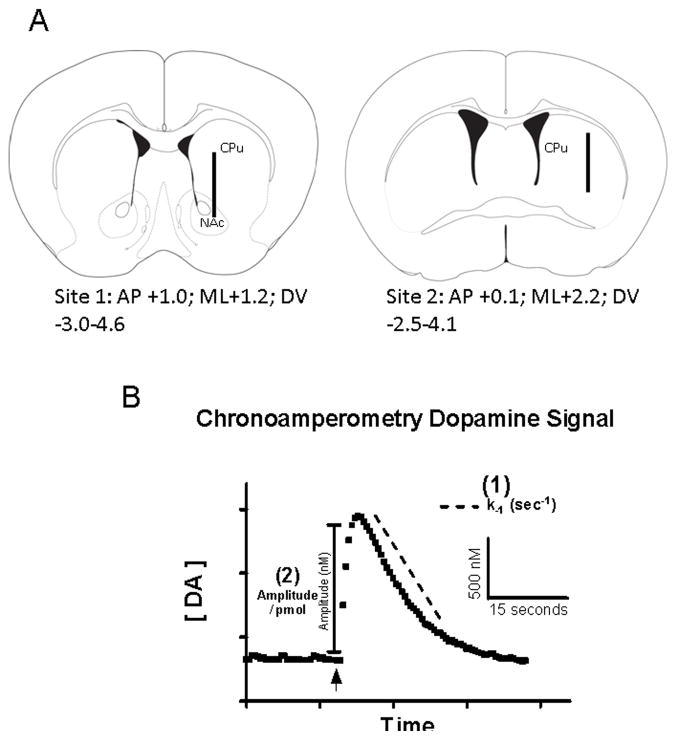
Figure 1.
(A) Microelectrode placement through the mouse dorsal striatum and nucleus accumbens. The diagrams show the approximate location of the microelectrode at site 1: AP+1.0 and site 2: AP+0.1 (relative to bregma; modified from Franklin and Paxinos (2001)). The microelectrode was moved in increments of 400 μm throughout the dorsal and ventral parts of the striatum. (B) Analysis parameters of the in vivo electrochemical DA signals. Following local application of DA solution (indicated by arrow), the amplitude (nM) is determined by calculating the change from a stable baseline using the calibration curves generated from each microelectrode prior to their use. The first order exponential decay constant, k−1 (sec −1) (1), is calculated from the decay portion of the DA signal fitted to the slope of the linear regression of the natural log transformation of the data. By dividing the resulting DA signal amplitude (nM) by the amount (picomole) of DA solution applied the amplitude per picomole (nM/pmol) (2) is calculated.

