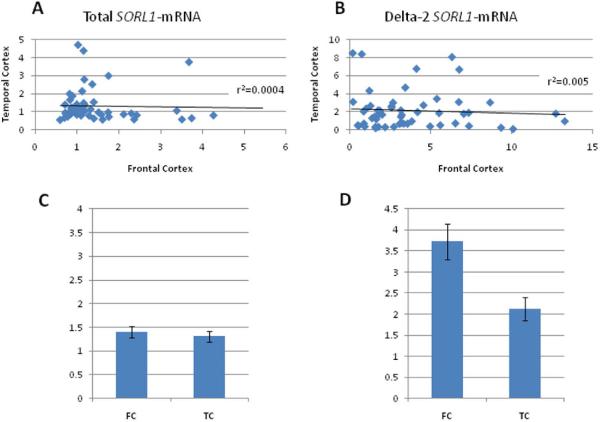
Figure 1. Comparison of SORL1 RNA levels between matched brain regions obtained from the same subjects (n=51).
Fold levels of total (A, C) and delta-2 (B, D) -SORL1-mRNAs were assayed by real-time RT-PCR using TaqMan technology and calculated relative to the geometric mean of SYP- and ENO-mRNAs reference control using the 2−ΔΔCt method. The analysis included matched frontal (FC) cortex and temporal cortex (TC) samples obtained from 51 subjects. (A) Total SORL1-mRNA levels in FC were not correlated with total SORL1-mRNA levels in TC (r2=0.0004). (B)Delta-2 SORL1-mRNA levels in FC were not correlated with delta-2 SORL1-mRNA levels in TC (r2=0.005). (C and D) The bar graph presents the average of SORL1-mRNA s fold expression (mean±SE) of the 51 subjects for each brain region. (C) No significant differences in the levels of total SORL1-mRNA levels were found between FC and TC (p= 0.53). (D) delta-2-SORL1 mRNA levels were significantly higher in the FC compared with TC (p=0.003).

