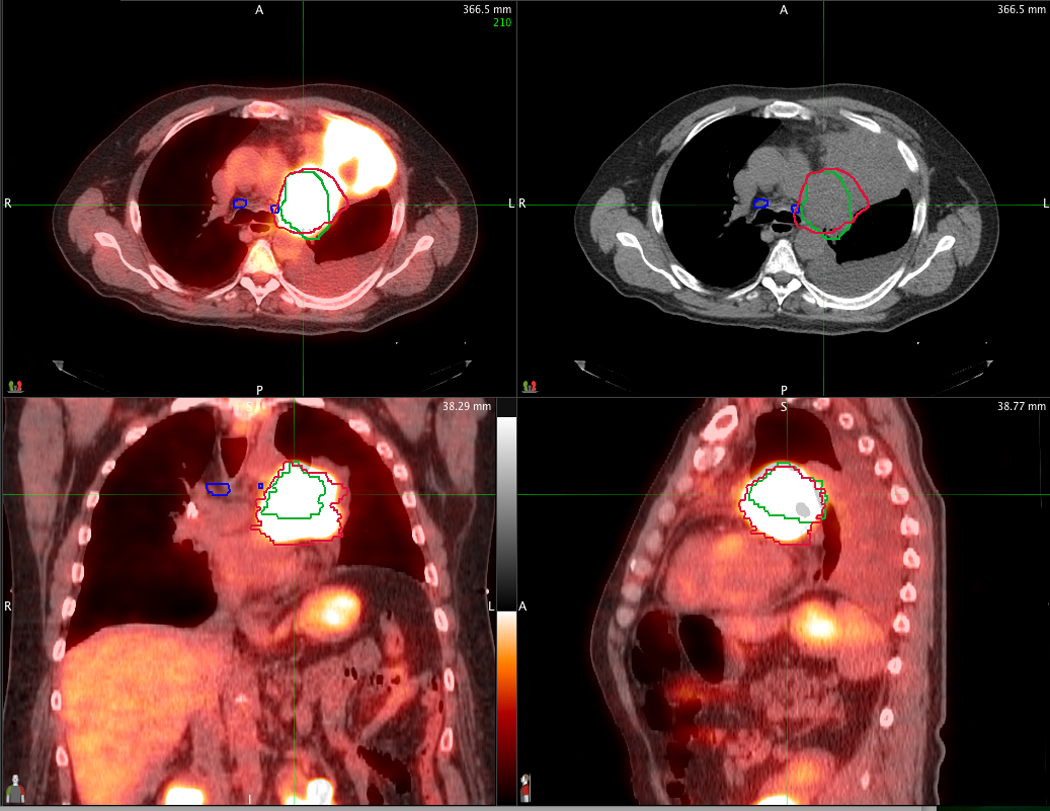
Figure 1.

An example of the difference between the defined GTV between PET/CT (red contour) and CT alone (green contour) in a patient with left upper lobe atelectasis. PET/CT images are displayed in axial, sagittal and coronal planes through the tumor. The corresponding CT alone axial image is displayed on the upper right.
