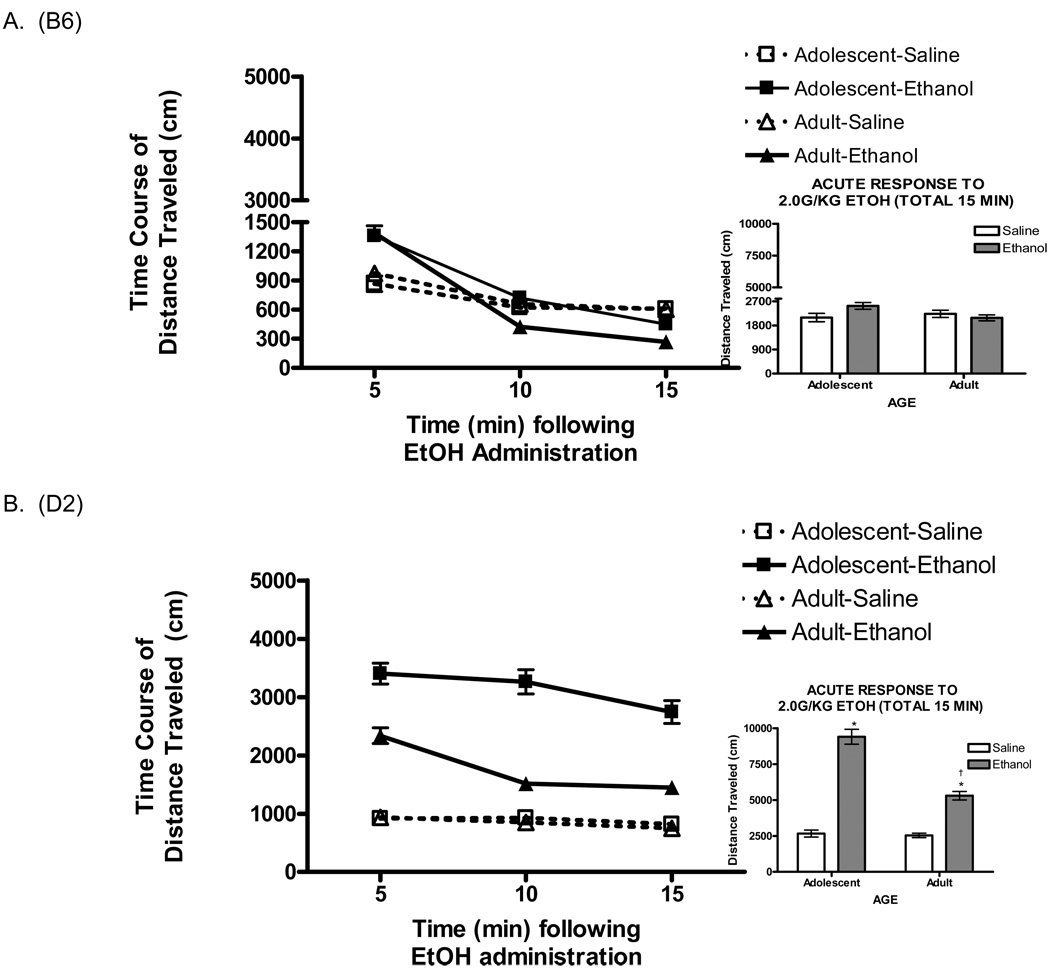
Fig. 1.
Temporal pattern of locomotor activity shown as 5 minute time bins ± SEM for B6 and D2 adults and adolescents. All animals displayed significant stimulant response in the initial five minutes of testing following ethanol administration. a) Average locomotor response fell below saline level in the final ten minutes for B6 adults and in the final five minutes for B6 adolescents. Total activity across the 15 minute test (inset) show that B6 mice do not show an overall stimulant response when activity is collapsed across the 15 minutes. b) D2 adults also show a decrease in activity five minutes after ethanol administration, but both D2 adults and adolescents stay above saline response for the entirety of the test. When total activity is collapsed (inset), D2 adolescents show a greater stimulant response than D2 adults.

