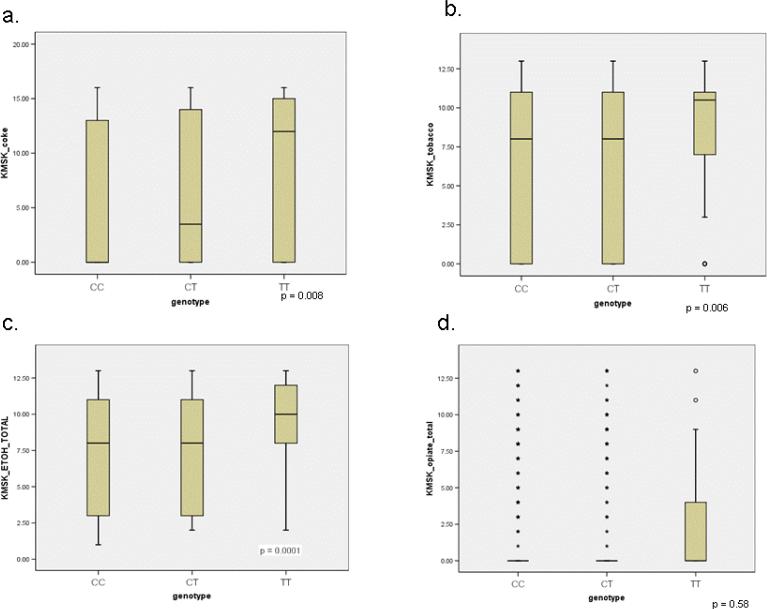
Figure 2. C17T genotype and KMSK score.
Box and whisker plots displaying distribution of KMSK scores for the CC, CT, and TT genotypes among African-Americans. Twenty-fifth percentile, 50th, and 75th percentiles are represented. Open circles represent single cases of outliers (1.5-3 interquartile ranges from the end of the box). Stars represent single cases of extreme values (> 3 interquartile ranges from end of the box). The 25th and 50th percentiles for the CC genotype for the KMSK cocaine scale overlap. Significance was determined with the Kruskal-Wallis test.

