
Figure 3.
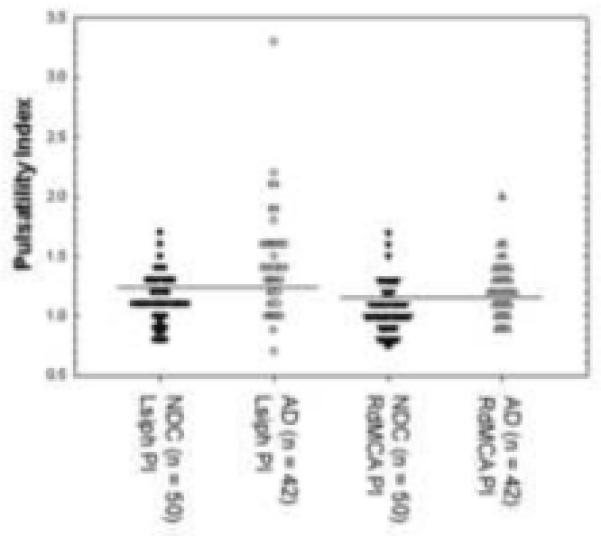
Distribution values for Lsiph and RdMCA pulsatility indices in AD and NDC subjects. The cutoff values are represented by the black horizontal lines. Notice that more of the AD values are above the cutoff line for the PI than below indicating that increasing PI is correlated with AD. NDC, non-demented control; AD, Alzheimer’s disease; PI, pulsatility index; Lsiph, left siphon; RdMCA, right distal middle cerebral artery.