
Figure 4. Optimization of stimulation frequency.
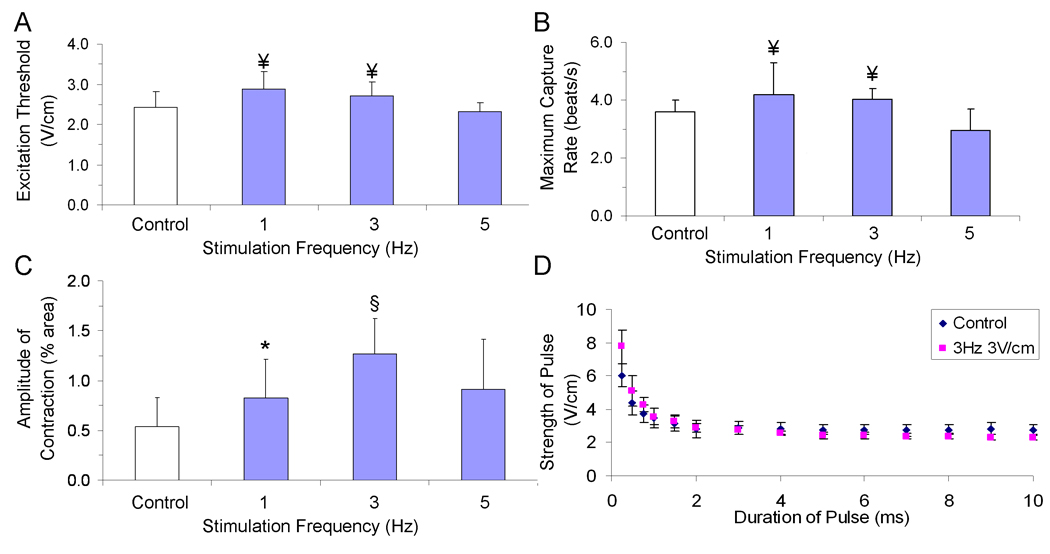
Contractile activity of tissue-engineered cardiac constructs cultured either under conditions of no stimulation (control) or with pulsatile electric-field stimulation (square-wave monophasic pulses, duration 2 ms) for 5 days with increasing frequencies of stimulation (A) Excitation threshold (electrical field that needs to be applied to induce synchronous contractions of cultured tissue constructs) (B) maximum capture rate (the maximum frequency at which tissue constructs can be induced to beat). (C) Amplitude of contraction ¥ significantly different from 5 V/cm group, * significantly different from control group, § significantly different from all other groups with one-way ANOVA test (p<0.05) n=5–10 from 3 separate experiments. (D) Strength-Duration Curve for control (blue) and stimulated (pink) constructs (n=3 each group).