
Figure 6. Tissue structure.
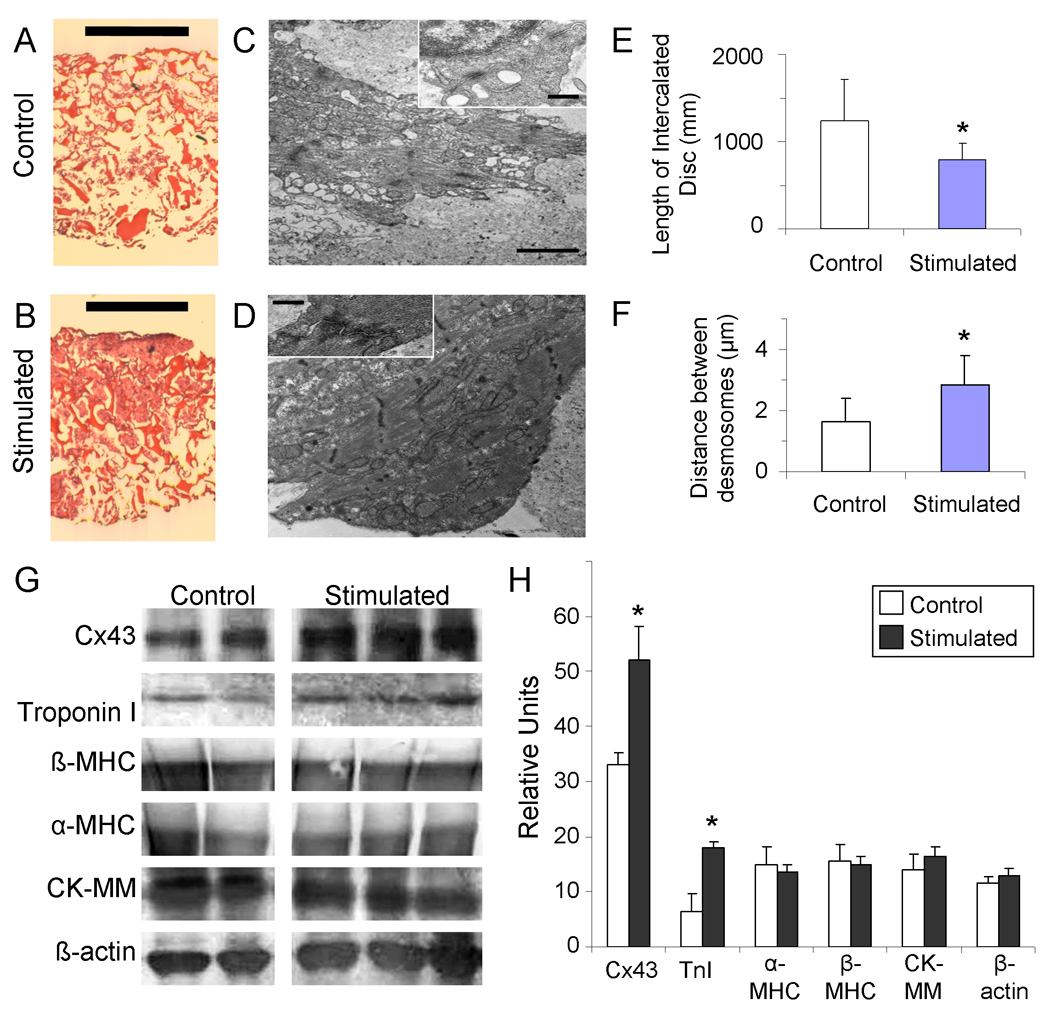
(A, B) Hematoxylin and Eosin staining of engineered tissue consttructs that were (A) unstimulated, or (B) stimulated with monophasic square wave pulses of 3 V amplitude, 3 Hz frequency and 2 ms duration. (Scale bar indicates 1 mm). (C, D) Tramsmission electron microscopy images of engineered tissue either (C) unstimulated during culture, or (D) stimulated with monophasic square wave pulses of 3 V amplitude, 3 Hz frequency and 2 ms duration, with insets of sarcomeres (scale bar indicates 2 um in main image, 500 nm in inset). (E) Length of intercalated disc. (F) Distance between desmosomes per each unit of intercalated disc (E, F) * p < 0.06 denotes statistical difference via Wilcoxon-Mann-Whitney U-test (n=4 each group) (G, H) Protein analysis of stimulated and control tissue for selected cardiac proteins. (G) Western blot for Connexin-43 (Cx-43), cardiac troponin-I, beta myosin heavy chain (β-MHC), alpha myosin heavy chain (α -MHC), muscle-type creatine kinase (CK-MM), and β-actin. (H) Band intensity as quantified by image analysis. * p<0.06 denotes statistical difference via Wilcoxon-Mann-Whitney U-test (n=2 control, n=3 stimulated).