Figure 4.
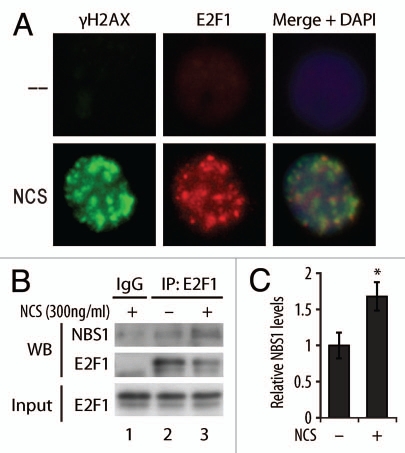
E2F1 localizes to DSB foci and associates with NBS1. (A) HCT116 cells were treated with 2 Gy of IR and IF staining was performed using antibodies to E2F1 and γH2AX and counterstained with DAPI. (B) NHFs were untreated (lane 2) or treated with NCS (300 ng/ml) for 3 h (lanes 1 and 3) before harvesting. Cell lysate was subjected to IP using control IgG (lane 1) or antibody to E2F1 (lanes 2 and 3). Western blot analysis was performed to detect NBS1 and E2F1 in the precipitate (WB) or the input cell lysate as a control (Input). (C) Relative levels of NBS1 protein immunoprecipitated with E2F1 were measured using ImageJ software from three independent experiments. *indicates statistically significant difference between untreated and NCS treated samples (student's t test, p < 0.05) and bars represent standard deviation.

