
Figure 3.
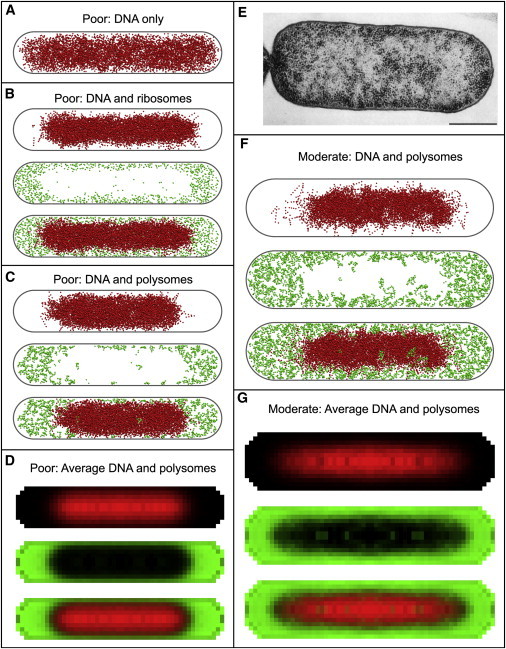
Distribution of DNA and ribosomes. Panels A-D correspond to poor growth conditions and F-G correspond to moderate growth conditions. (A) A 50 nm central slice through a snapshot of the DNA polymer configuration with no ribosomes present. (B) 50 nm central slice showing DNA (top) and ribosomes (middle) when ribosomes are present as monomers. A merge of both types of beads is shown at the bottom. (C and F) 50 nm central slice showing DNA (top) and ribosomes (middle) when ribosomes are present as polymers. A merge of both types of beads is shown at the bottom. (D and G) Average distribution of DNA (top) and ribosomes (middle) in an infinitesimal central slice. A merge of both types of beads is shown at the bottom. (E) Electron microscope image of DNA (light gray regions) and ribosomes (dark dots) from a thin section of an E. coli cell. Reproduced from Hobot et al. (46) with permission from American Society for Microbiology.