
Figure 2.
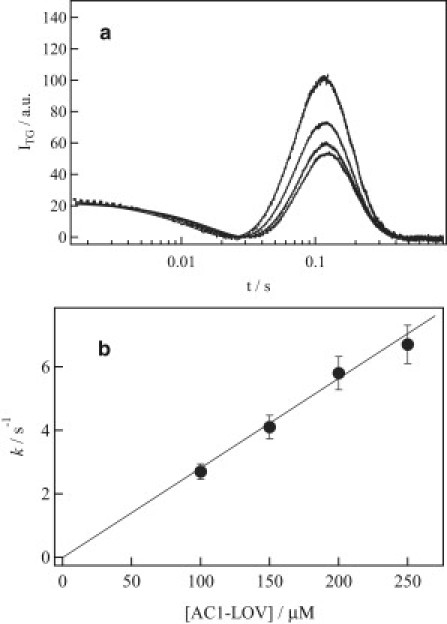
(a) Dependence of the diffusion signal of AUREO1-LOV on concentration measured at q2 = 1.6 × 10¹⁰ m−2. The concentrations are, from top to bottom, 100, 150, 200, and 250 μM. (b) Dependence of the rate constant (k) of the change in diffusion on concentration.