
Figure 4.
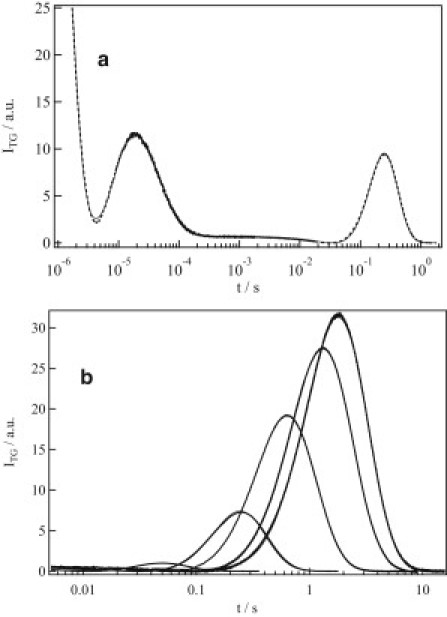
(a) A typical TG signal (dotted line) of AUREO1-ZL at a concentration of 250 μM at q2 = 7.2 × 10¹⁰ m−2. The line of best fit calculated based on a two-state model (Eqs. 1 and 3) is shown as a solid line. (b) Dependence of the diffusion signal of AUREO1-ZL (dotted line) on grating wavenumber (q) measured at, from left to right, 72, 12, 3.9, 1.7, and 1.2 × 10¹⁰ m−2. The solid line is the line of best fit, calculated based on a two-state model (Eqs. 1 and 3), which overlaps well with the observed signals.