
Figure 2.
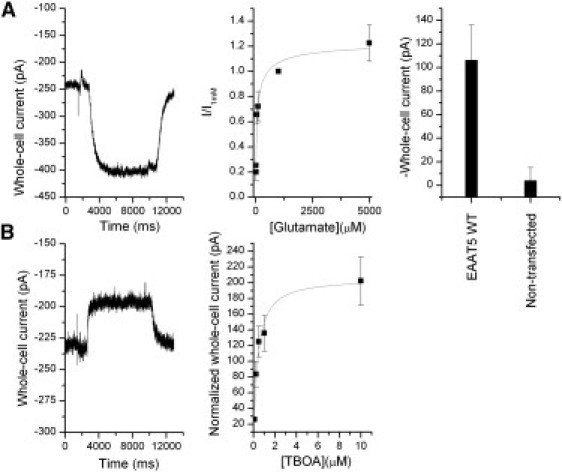
(A) Left: Typical anion current induced by the application of 60 μM glutamate. Right: Comparison of average responses to 100 μM glutamate application of nontransfected control cells and cells transfected with EAAT5 WT. Middle: Glutamate concentration dependence of EAAT5 anion whole-cell currents. The currents were normalized to the current at 1 mM glutamate. The data were fitted to the Hill equation with an apparent Km= 61 ± 11 μM, n = 0.6 ± 0.1. (B) TBOA inhibition of the leak anion current of EAAT5, yielding Ki = 0.4 ± 0.1 μM. The transmembrane potential in A and B was 0 mV. Anion currents were recorded in the presence of intracellular KSCN.