
Figure 5.
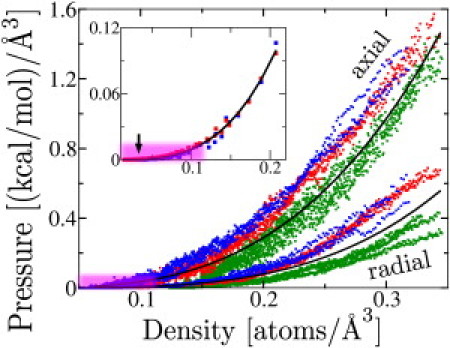
Pressure versus density of unfolded flagellin. Flagellin pressure versus density for nine compression simulations at cylinder radius 5 Å (green), 7 Å (red), and 9 Å (blue). (Upper three curves) Axial pressure. (Lower three curves) Radial pressure. Each data point represents a 10-ps snapshot as the compression progresses (from bottom left to top right). (Two black curves) Average fit of Eq. 12 to the axial (p = 36(ρ/ρ0)3) and radial (p = 26(ρ/ρ0)3.6) pressures (in units (kcal/mol)/[Angstrom symbol]3). (Inset) Radial (red) and axial (blue) pressure versus density for 60 equilibrium simulations (each data point marks the average pressure and density of a single simulation). (Black curve) Average fit of Eq. 12 to the axial and radial pressures (p = 15(ρ/ρ0)3.2). (Arrow) Location of an R = 13 Å, L = 150 Å data point used to match the Gaussian chain model to simulation data, with b (refer to Eq. 11) as the fitting parameter. (Purple highlight) Pressure and density range relevant to the flagellum.