Fig. 5.

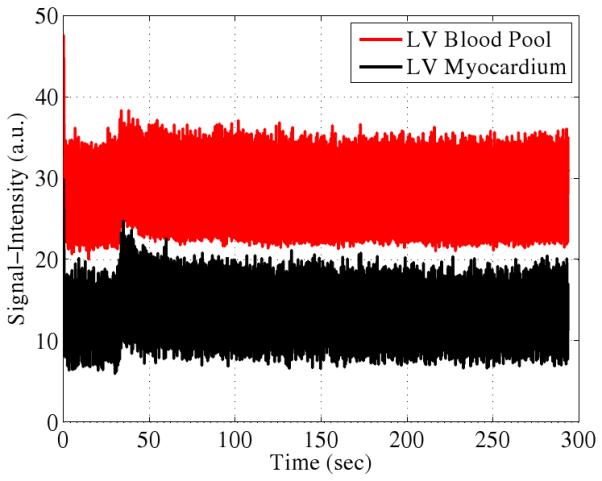
Representative experimental first-pass perfusion signal-intensity curves. The wash-in and wash-out are visible as is the residual contrast agent at long time scales.

Representative experimental first-pass perfusion signal-intensity curves. The wash-in and wash-out are visible as is the residual contrast agent at long time scales.