Figure 1.
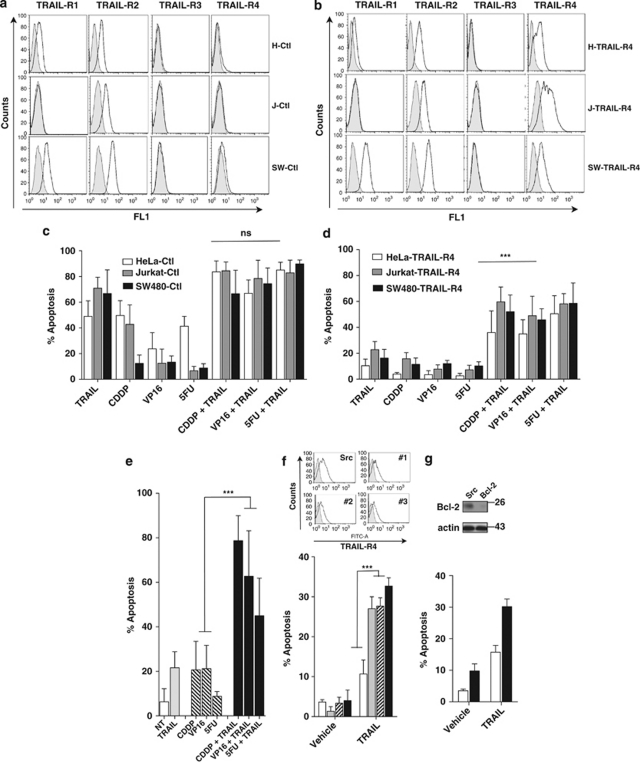
Chemotherapeutic drugs restore TRAIL-induced cell death in TRAIL-R4-expressing cells. (a) and (b), HeLa, Jurkat or SW480 cancer cell lines were infected with empty vector (H-Ctl, J-Ctl or SW-Ctl) or with a vector encoding TRAIL-R4 (H-TRAIL-R4, J-TRAIL-R4 or SW-TRAIL-R4). Expression of TRAIL receptors was analyzed by flow cytometry (gray line) against an isotype control (filled curve). (c) and (d), control cells or TRAIL-R4-expressing cells were stimulated with His-TRAIL (500 ng/ml, 6 h), Cisplatin (CDDP, 20 μM, 3 h), etoposide (VP16, 10 μM, 3 h) or 5-fluorouracil (5FU, 1 μg/ml, 72 h). Apoptosis was evaluated after 6 h (TRAIL), 48 h (CDDP or VP16) or 72 h (5FU) by Hoechst staining in HeLa (white), Jurkat (gray) or SW480 (black). Sequential stimulation with chemotherapeutic drugs and TRAIL was performed as follows. Cells were pre-treated with CDDP or VP16 for 3 h, in serum-free medium, then washed and allowed to recover at 37 °C in complete medium for 48 h before stimulation with His-TRAIL (500 ng/ml) for an additional 6 h. Alternatively, cells were stimulated for 72 h with 5FU, then His-TRAIL for 6 h. (e) VAL cell sensitivity to His-TRAIL, chemotherapy or sequential treatments was analyzed as described above. (f) Deregulation of TRAIL-R4 expression in VAL cells using three different siRNAs (scramble siRNA, Src; TRAIL-R4 siRNA, #1, #2 and #3) as analyzed by Facs for TRAIL-R4 expression using an anti-TRAIL-R4 antibody (gray line) or a control isotype (filled curved). The effect of TRAIL-R4 downregulation was assessed by Hoechst staining 6 h after His-TRAIL treatment (500 ng/ml), scramble (white) and TRAIL-R4 siRNA (#1 gray; #2 dashed and #3 black). (g) Bcl-2 expression in VAL cells after transfection with the scramble siRNA (Src) or the Bcl-2 siRNA (Bcl-2) and corresponding Hoechst staining 6 h after His-TRAIL treatment (500 ng/ml), Bcl-2 siRNA (in black) or a scramble siRNA (in white). These results are representative of at least three independent experiments. Mean percentage of apoptotic cells and S.D. shown (mean±S.D.). Differences between selected groups were compared by non-parametric analysis of variance (ANOVA) with Bonferroni post hoc multiple comparison test, ***P<0.001. Molecular size markers are shown on the right in kDa

