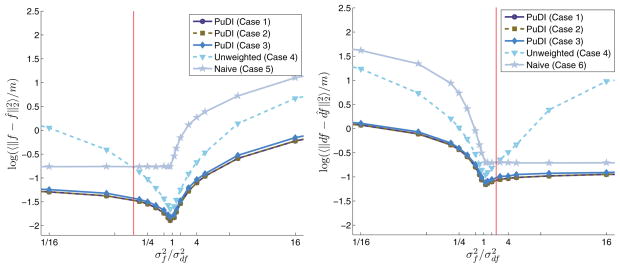
Fig. 5.1.
AMSE of f(x) (left panel) and ∂f(x) (right panel) using various semiparametric estimators. The x-axis plots the ratio of the variance of the f noise to that of the ∂f noise, and the y-axis contains the AMSE measured over 1 × 10⁴ Monte Carlo simulations. In each case the weighted PuDI methods (Cases 1–3) outperform the other estimators. These plots also demonstrate how findings from simple multivariate arguments carry through to these nonlinear semiparametric regression spline fits. The vertical (red) lines indicate the point at which the naive estimator (using only f or ∂f information) outperforms the PuDI estimator using f and ∂f but weights all the observations equally (i.e., Case 4). See the text for additional details.

