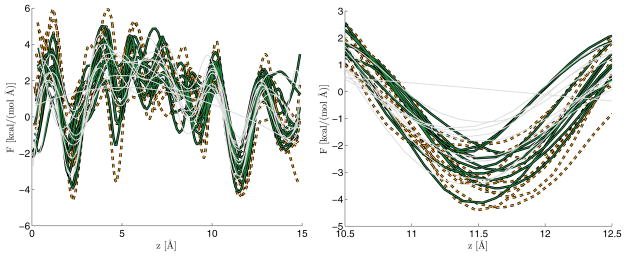
Fig. 5.2.
The different curves correspond to the effective force estimated from 10 realizations of time series data. After processing these time series, we obtained sets of 10 scatterplot data. These data sets were then processed with design matrices C2 (dark solid), C4 (dashed), and C5 (light grey). The underlying scatterplot data is the same regardless of the design matrix used; differences in curves are due only to the P-spline design matrix. The left panel shows the entire realizations, while the right panel zooms into a major binding pocket of the channel. Note that in this plot the variable z corresponds to the state of the resolved coordinate denoted by x in the text. z is often used to denote axial position in this system; in this figure, z does not have the meaning used in section 3.

