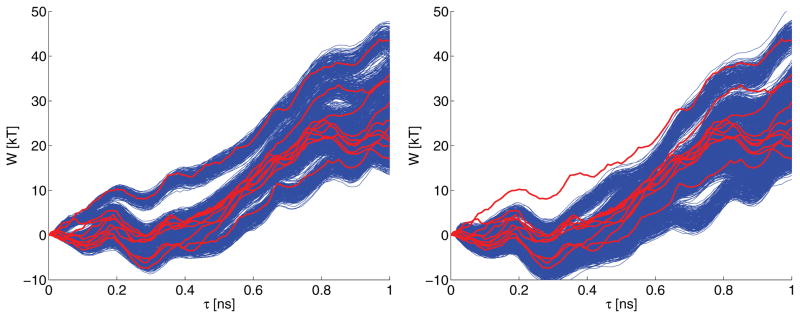
Fig. 5.3.
The work tubes simulated using the 10 SDEs constructed from stitching together local SDE models by P-spline design matrices C2 (left panel) and C4 (right panel). Each work tube is made of 1,000 work trajectory simulations using the 10 global SDEs previously mentioned. The thick lighter color curves correspond to the work trajectories measured directly from the 10 steered molecular dynamics simulation (one work trajectory per steered molecular dynamics trajectory). The P-splines used the same scatterplot data in the left and right panels; only the design matrix changes, and this alone explains the difference in the estimated curves.

