Figure 9.

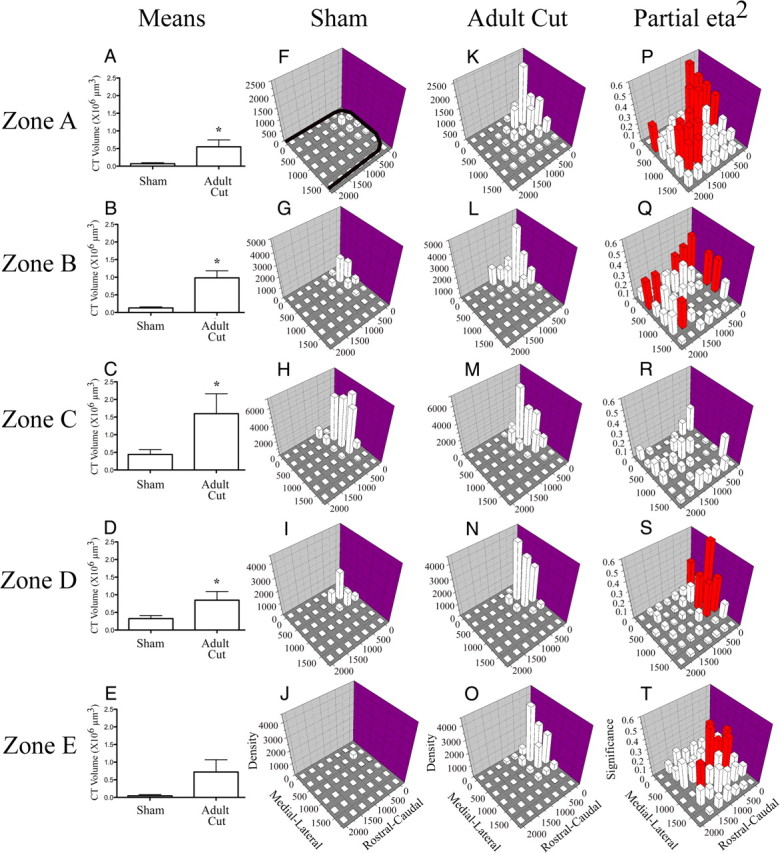
Chorda tympani nerve terminal field volumes and densities in x, y, and z planes in adult cut rats compared with sham controls. A–E, Mean (±SEM) chorda tympani nerve terminal field volumes in cut rats are greater than sham controls in four of five dorsal–ventral zones. F–O, Density of terminal field label is shown for sham (F–J) and adult cut rats (K–O). The medial–lateral axis represents distance (μm) from the medial border of the NTS and rostral–caudal axis represents distance (μm) from the rostral pole of the NTS (see axes labels in J and O). The graphs are oriented along the same axis as the NTS is in the brainstem (see solid black line in F for outline of the NTS; also see Figs. 3 and 6). The z-axis represents the mean density of label (“Density” in J and O represents the volume of terminal field label/volume of the NTS contained within the grid box × 105 μm3). See Materials and Methods for further detail. In each dorsal–ventral zone, the label was denser in the x and y planes for the adult cut rats (F, K, G, L, H, M, I, N, J, O). P–T shows the magnitude of the statistical effect resulting from comparisons within each grid box for each dorsal–ventral level. The medial–lateral and rostral–caudal axes are the same as described for F–O. The z-axis in P–T show the partial η squared values obtained from the MANOVA analysis. The greater the partial η squared value (represented as “Significance” in T), the more significant the differences were between groups for the respective grid box. Red bars represent p < 0.05. With the exception of zone C, there were significant differences between the two groups across the X, Y plane.
