Figure 2.
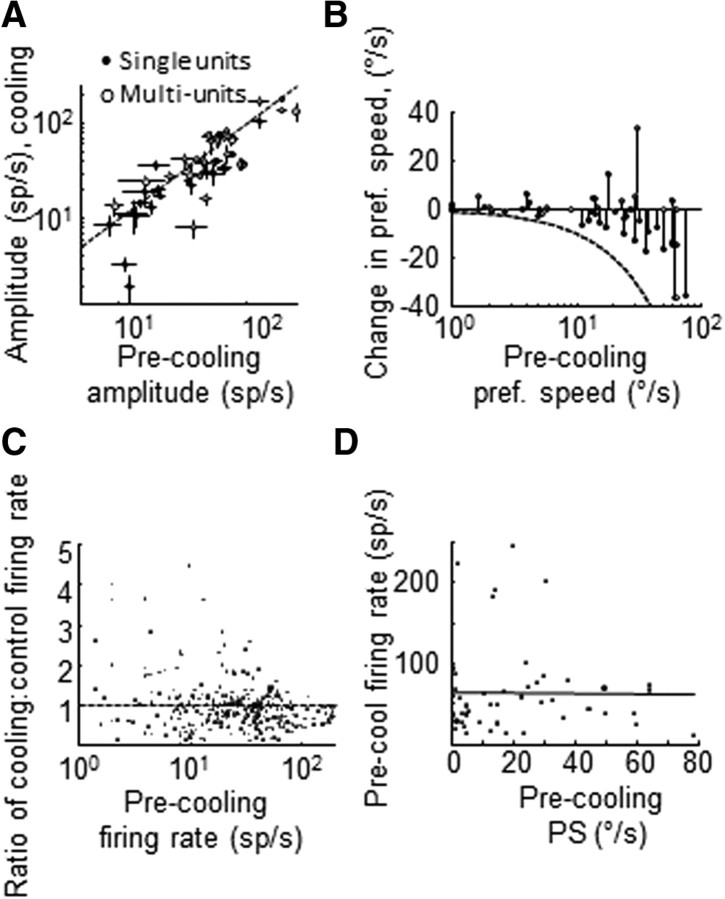
MT speed tuning during V2/V3 inactivation. A, Speed tuning curve amplitude values measured before and during cooling (±SEM). Closed dots, single units; open dots: multiunits. B, Change in preferred speed during cooling as a function of control preferred speed. Closed dots, single units; open dots, multiunits. Broken line shows the theoretical maximal decrease in preferred speed. C, Change in firing rate as a function of control firing rate. Each dot shows the ratio (cooling/control) of average spike counts to a given trial type for all neurons. D, Control firing rate measured at each unit's preferred speed. Black line shows the correlation line.

