Figure 6.
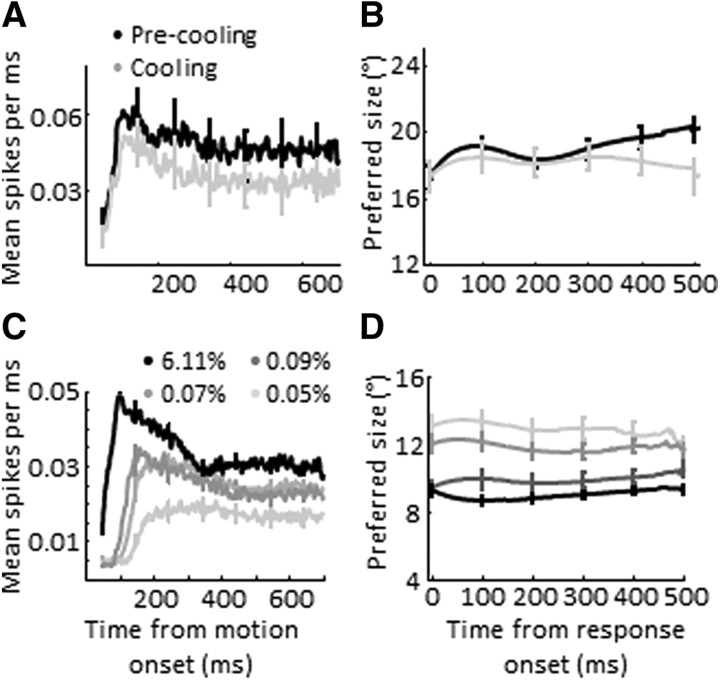
Temporal dynamics of size tuning in MT. A, Average response (±SEM) for all units with surround suppression > 20% before (black) and during cooling (gray). B, Average preferred size (±SEM) for all units with surround suppression >20%), aligned by each neuron's response onset, before (black) and during cooling (gray). C, Average response (±SEM) for all units with surround suppression > 20% during high (black)- and low (gray)-contrast conditions (RMS contrast levels of 0.05, 0.07, 0.09, and 6.11). D, Average preferred size (±SEM) for all units with surround suppression >20%, aligned by response onset, during high (black)- and low (gray)-contrast conditions.

