Figure 1.
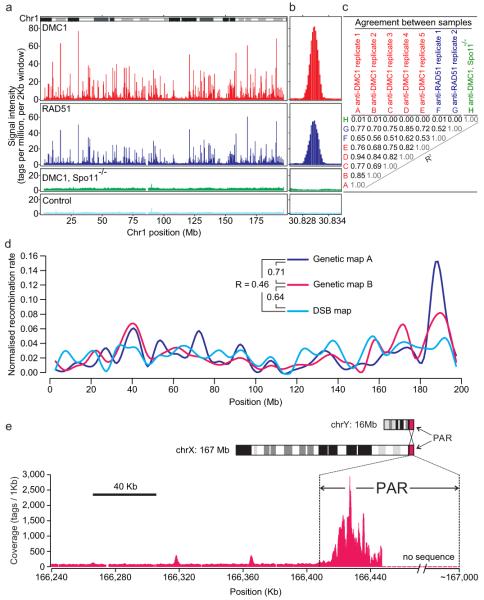
DSB hotspots in the mouse genome. a. The ChIP-seq tag density profiles. DMC1 and RAD51: anti-DMC1 and anti-RAD51 ChIP. DMC1, Spo11-/-: anti-DMC1 ChIP from Spo11-/- mice that do not form DSBs. Control: IgG ChIP and input DNA pool. b. Close-up of a representative hotspot. c. Agreement between ChIP-Seq samples (correlations in 2 kb bins across genome). d. Correlation between the DSB hotspot map and the published genetic maps A15 and B16 for chromosome 1. The DSB map is generated from hotspot strengths (Supplementary Methods). All maps are generated in 5 Mb windows and normalized by area of the map. e. PAR contains a large cluster of overlapping hotspots. DMC1 ChIP-Seq tag coverage (smoothing window = 1 kb, step size = 100 bp).

