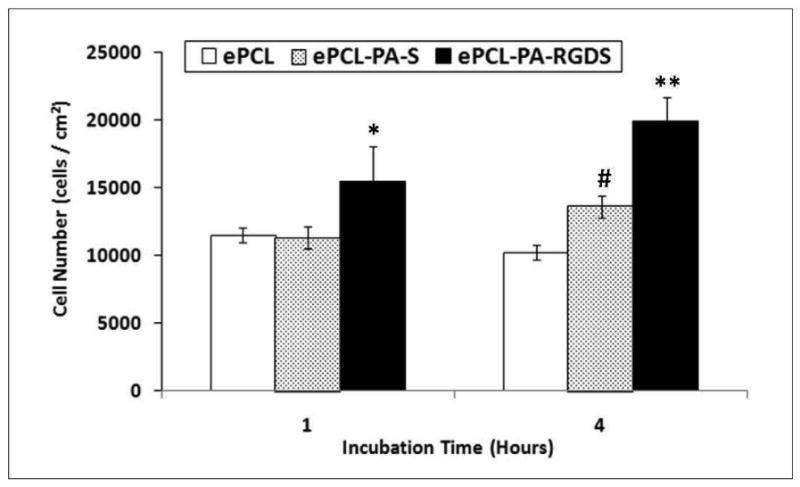
Figure 6.

Initial attachment of hMSCs shows that at both timepoints, significantly higher numbers of cells attached on ePCL-PA-RGDS compared to ePCL and ePCL-PA-S (*: p<0.05, **: p<0.01). After 4 hours, cell attachment was significantly higher on ePCL-PA-S compared to ePCL (#: p<0.01). Error bars represent means ± standard deviation. n = 4.
