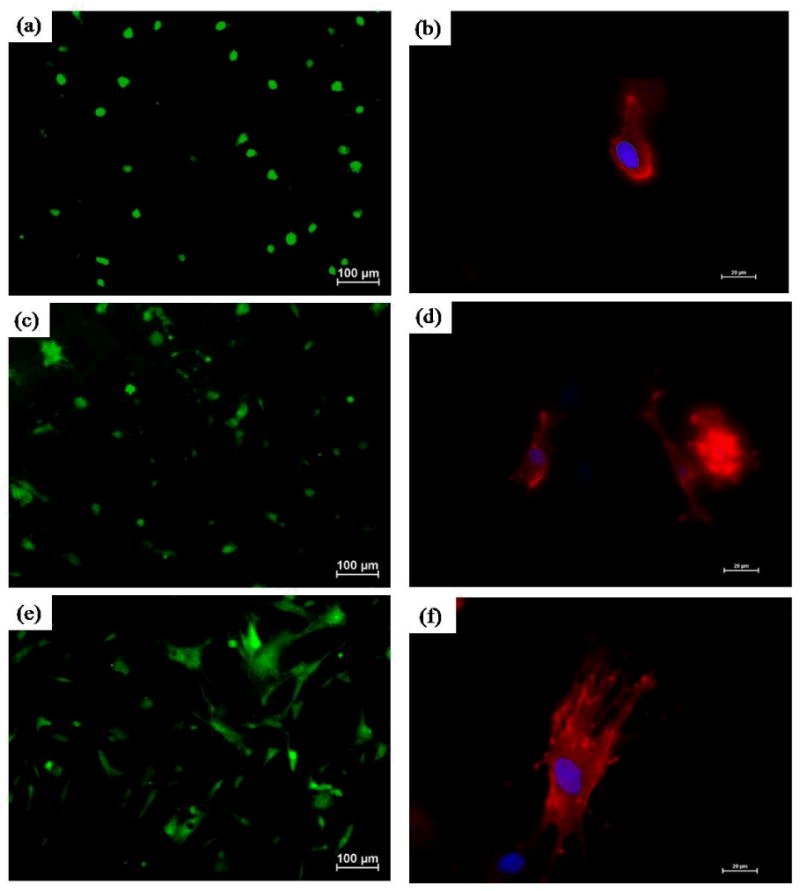
Figure 7.

Representative images of hMSC spreading using Live/Dead assay on (a) ePCL (c) ePCL-PA-S, and (e) ePCL-PA-RGDS. Magnification = 10×, scale bars = 100 μm. Representative images of hMSC morphologies using rhodamine-phalloidin staining on (b) ePCL, (d) ePCL-PA-S, and (f) ePCL-PA-RGDS. Magnification = 40×, scale bars = 20 μm. These images clearly show that cells were more spread and had greater F-actin fiber formation on ePCL-PA-RGDS than on ePCL or ePCL-PA-S.
