
Fig. 3.
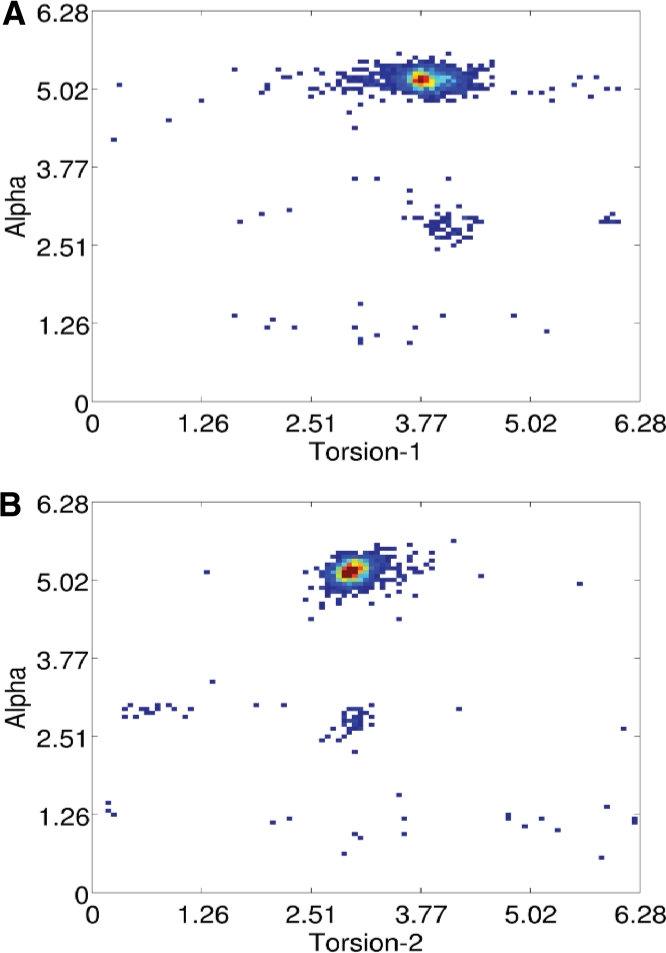
(A) Empirical distribution density of the torsion (τ1) on the pseudo−bond C4′-−P and α. (B) Distribution density of the torsion (τ2) on the pseudo−bond P-C4′ and α. The empirical distributions are built from all representative RNA structures (see Section 2.4).