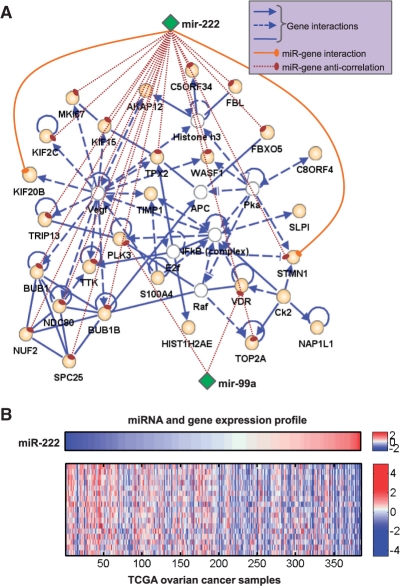
Fig. 3.
Network analysis of comodule 40. (A) The highly connected network consists mainly of genes in comodule 40 (orange nodes), but also includes 6 genes identified using the IPA system (white nodes). Two miRNAs (miR-222, miR-99a, green nodes) are also shown. Based on the MicroCosm Targets V5.0 dataset, miR-222 targets two genes (solid line). Significant anti-correlations between miRNAs and genes are shown with dashed lines. (B) Anti-correlations between miR-222 and gene expression profiles (Pearson's correlation coefficients <−0.21, P-value <5.0×10⁻⁵).

