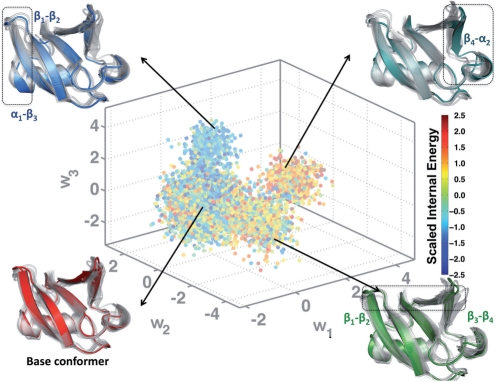
Fig. 2.
Organizing the conformational landscape of ubiquitin into energetically homogenous regions: Projections (w1−w3) of the conformations from the ubiquitin simulation onto the top three anharmonic basis vectors are colored according to the scaled internal energy values of the conformers. Also shown are the results from hierarchical clustering (Section 6), where a total of 78 clusters were identified. The arrows indicate portions of the landscape from where some of the clusters originated. Illustrative examples of cluster centers are shown as colored cartoons; overlaps with the other cluster centers are shown as transparent gray cartoons. In each of the example cluster centers, the region that undergoes the maximal conformational change is highlighted using a dotted rectangle. The corresponding secondary structures are marked for ease of identification.

