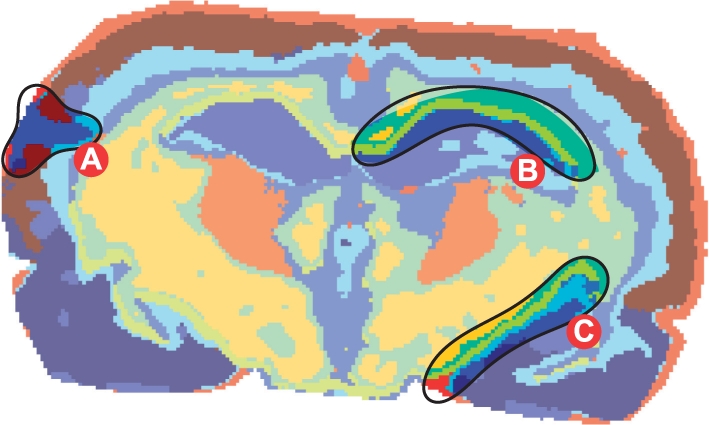
Fig. 6.

Segmentation map (SA method) for the rat brain dataset, r=3, q=20, k=10. Region A shows a tissue slice preparation defect (see in text, Section 3.1.1). Regions B and C highlight an SA-specific artifact, a layer of chartreuse yellow pixels along hippocampus (see in text, Section 3.1.4).
