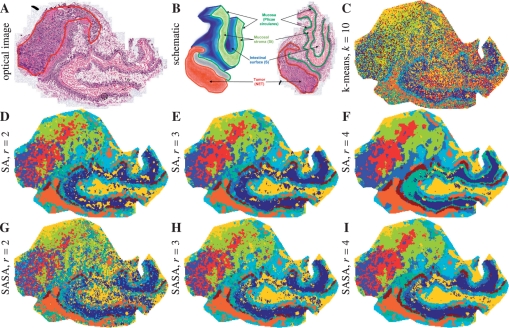
Fig. 9.
Neuroendocrine tumor dataset. (A) Optical image after H&E staining, the tumor region is selected. (B) 3D structure of the tissue and optical image with main functional structures, reproduced from (Alexandrov et al., 2010) with permission from the American Chemical Society). (C–I) Segmentation maps, k=10. (C) Straightforward clustering of spectra. (D–E) SA method. (G–I) SASA method.

