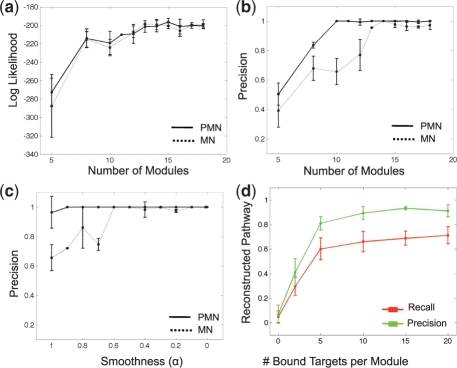
Fig. 3.
Performance on synthetic data. (a) Log likelihood of test samples, achieved by PMN (solid line) and MN (dashed line) as a function of module number. Plots show average over 10-fold cross validation experiments; error bars show 2 STD. (b) Precision rate of reconstructing regulator-target pairs, achieved by PMN and MN, as a function of number of modules. Plots as in (a). (c) Precision rate of reconstructing regulator-target pairs, achieved by PMN and MN, as a function of smoothness of the expression data. Plots as in (a). (d) Reconstructed pathways as a function of noise in the protein–DNA data. Plots show average precision and recall over 10-fold cross validation; error bars indicate 2 STD.

