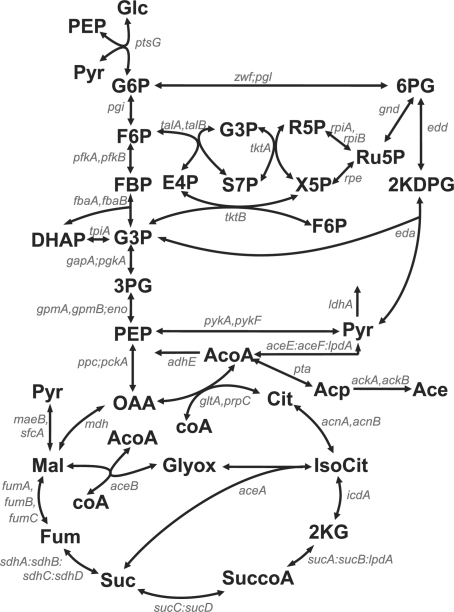
Fig. 3.
Scheme of E.coli central carbon metabolism. This map, showing metabolites (bold fonts) and genes (italic) is adapted from (Ishii et al., 2007). Abbreviations of metabolites are glucose (Glc), glucose 6-phosphate (G6P), fructose 6-phosphate (F6P), fructose 1-6-biphosphate (FBP), dihydroxyacetone phosphate (DHAP), glyceraldehyde 3-phosphate (G3P), 3-phosphoglycerate (3PG), phosphoenolpyruvate (PEP), pyruvate (Pyr), 6-phosphogluconate (6PG), 2-keto-3-deoxy-6-phospho-gluconate (2KDPG), ribulose 5-phosphate (Ru5P), ribose 5-phosphate (R5P), xylulose 5-phosphate (X5P), sedoheptulose 7-phosphate (S7P), erythrose 4-phosphate (E4P), oxaloacetate (OAA), citrate (Cit), isocitrate (IsoCit), 2-keto-glutarate (2KG), succinate-CoA (SuccoA), succinate (Suc), fumarate (Fum), malate (Mal), glyoxylate (Glyox), acetyl-CoA (AcoA), acetylphosphate (Acp) and acetate (Ace). Cofactors impacting the reactions are not shown. The gene names are separated by a comma in the case of isoenzymes, by a colon for enzyme complexes, and by a semicolon when the enzymes catalyze reactions that have been lumped together in the model.

