Fig. 8.

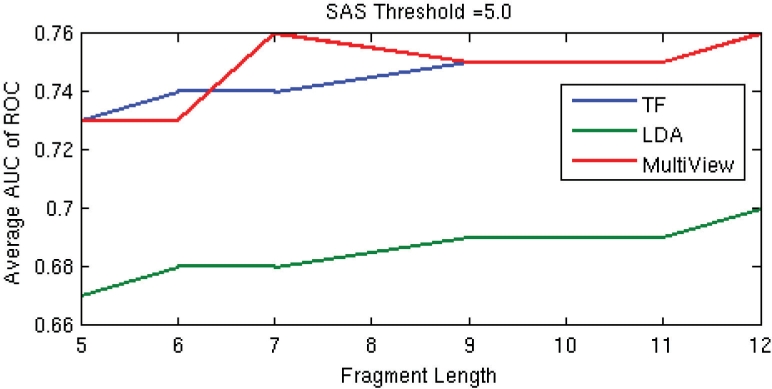
Comparison of the average AUC at SAS threshold of 5.0 Å, across libraries, obtained using TF, LDA and multiview model using the best weights from Table 5.

Comparison of the average AUC at SAS threshold of 5.0 Å, across libraries, obtained using TF, LDA and multiview model using the best weights from Table 5.