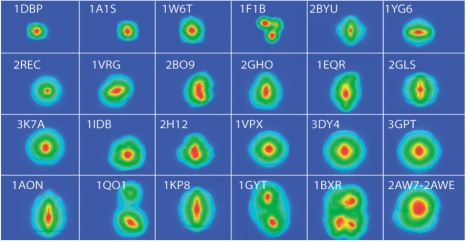
Fig. 5.
Average minimum feature vector distance maps. Contour level plot of the average minumum feature vector distance maps for 24 complexes. The value assigned to each grid voxel in a map is the average minimum distance between its feature vector and the feature vectors in the density maps of all the other complexes. The contour plane contains the maximal value. Colors are based on a rainbow scheme with red as the maximum and blue as the minimum values. The PDB ID of each complex structure is also shown.

