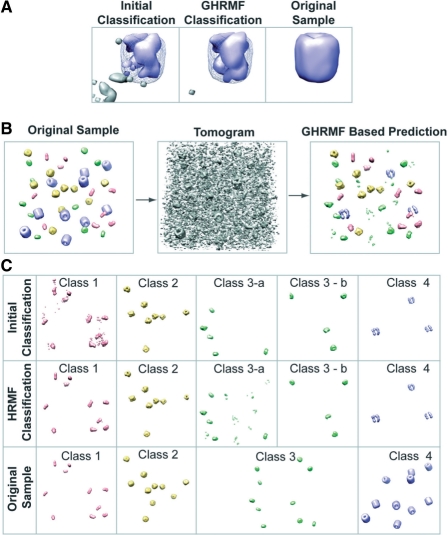
Fig. 6.
(A) (Left panel) Initial classification for a density region that contains a proteasome complex (blue color). It is evident that the proximity of the complex contains voxels that are false classified as being part of another complex class (grey color). (Middle panel) After GHMRF-based refinement, most of the voxels assigned to the second complex class have been removed. (Right panel) Original density map of the proteasome complex at 4 nm resolution, shown without noise, missing wedge, CTF and MTF distortions. (B) Classification for a tomogram of set 1: left panel shows the initial density map of the sample collection of four different types of complexes, each with 10 copies. (middle panel) Based on this sample a tomogram is simulated with an SNR of 0.5. (Right panel) The GHMRF-based classification discovers several sets of recurrent density patterns that represent the different complexes in the sample. (C) (Top panel) The initial classification discovers five different classes of patterns, each containing several instances. (Middle panel) The GHMRF-based reclassification improves the predictions considerably. (Lower panel) The four different classes of complexes in the initial dataset. It is evident that complexes in class 3 have been divided into two classes in the GHMRF-based classification. However, all complexes classified to the same class are identical. (The selected example shows an average classification performance.)

