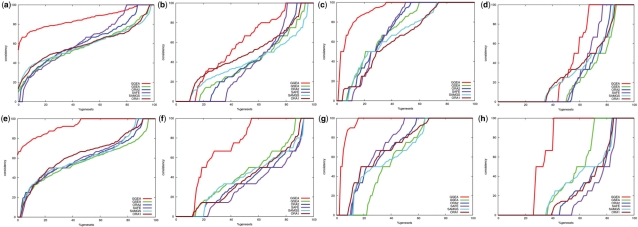
Fig. 4.
Consistency of regulatory interactions in top ranked sets. Plots (a)–(h) are explained in the main text. Each of the set enrichment methods was applied to 1000 E.coli datasets using KEGG and GO gene set definitions, respectively. From datasets with statistical significant outcome, the top ranked gene sets were collected and investigated for consistency of weak and strong activation and inhibition (as described in Section 2). GGEA results are displayed in red. The plots show which fraction (x-axis) of the identified gene sets had at most a consistency of y%. The y-axis shows the consistency of sets as the fraction of consistent regulatory interactions in the respective gene set. The null consistencies were estimated via the overall consistency of all gene sets in all datasets and are displayed in dark blue.

